User:Sandrine
Beijing Dynamic Density
Beijing has gone through significant social, economical and cultural changes since the foundation of PRC, different phase of development left various footprints on the population distribution both spatially and contently. Therefore, by discussing the dynamic change of its population, we can look back how the city grew in the past and where it heads for in the future.
Beijing saw 6 dynasties prosper and die and has a history of 3000 years, the military fortification function of the Feudalism period endowed Beijing with the traditional city-wall and chessboard urban structure. The previous chessboard structure of the city continued until the new construction and planning of Beijing started in the 1950s and remains its power in today’s city planning. When the PRC was newly founded, Beijing was considered as a political, administrative center, later as both administrative center and industrial center in the following 20 years. The limitation of economy and social development failed to stretch the planners’ eyes to its cultural and internationally communicative value as an international city today. However, this didn’t prevent the urban expansion in both area and population after the Reform and the Openness.
The urban area spreads as follows:
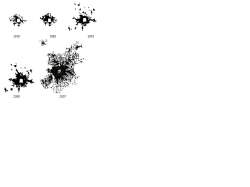
Picture 1: the footprint of Beijing in the main years from 1959 to 2007
(data resource : ??? and processed data from google earth 2007.1, China. )
Looking into the inner change we can see: in spite that Beijing is ‘sprawling’, Beijing has been and is undergoing a distinguished process of urbanization.
According to the analysis by Fengjian and Zhou Yixing(2003, the Growth and Distribution of Population in Beijing Metropolitan Area (1982-2020) ), the population both inside and outside the 3rd to 4th ring (the 4 surrounding-center area) flow to this area( usually called near-suburb area of Beijing, including most part of Haidian District, Chaoyang District, Shijingshan District and Fengtai District). The most concentrated streets in the former high-density area show marked decrease in population density while the density contour lines expand toward the 3rd and the 4th ring, which implies the trend of suburbanization as is shown in Graph 1 and Picture 2.
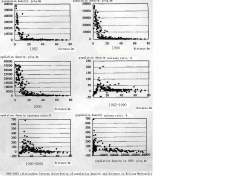
Graph 1: relationship between distribution of population density and distance in Beijing Metropolis 1982-2000.
In addition, their analysis based on SAS8.0 Poly-center regression model says that the poly-centric trend in Beijing started in the 1990s and formed its rudiment in around 2000, which is further reinforced by the Beijing Urban Master Plan for 2004-2020, in which sub-center and satellites take the responsibility for diluting the population density in the central area and alleviating the painstaking transportation congestion and environmental pollution caused by automobile.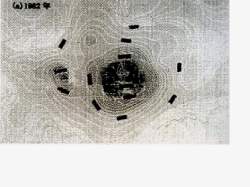
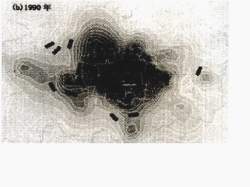
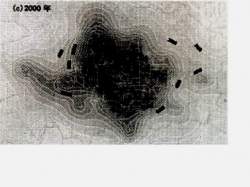
Picture 2: population density contour map of Beijing Metropolitan Area in different years(1982,1990,2000)
Whether applying to mono-centric or poly-centric is a debate in deciding how the city should form its arms and legs. Mono-centric can be a good explanation in promoting efficiency, for every selected point can find a direct access to the center, and many cities in the past especially in the cities with no natural obstacles testified the theory. But as the city spreads, the people in the outer circles find harder access to the center because the road area doesn’t increase exponentially with the increase of users in the outer circles, thus transportation becomes congested. Even today, we can modify the ‘road’ by putting them underground or over the earth, the accelerating demand still brings a balance between the commuting expenditure and the house renting.
As to the poly-centric model, the increase of the number of the sub-centers takes advantage of promoting specialization in each sub-center, in this way, each specialized activity, either administrative, industrial or educational can be relatively converged in a given area thus is more efficient. However, ADR increases as the sub-center amounts according to Alain.Bertaud and Stephen. Malpezzi’s model, implying that the efficiency decreases.
Referring to the case of Beijing, it is not simply drawing a compromise between mono-centric and poly-centric structure, for Beijing has a special center which differs from the traditional commercial center and it has formed ambiguous sub-centers which gives no sound reason for their spatial distribution. Besides, Beijing has its chessboard texture and circular skeleton, in which sub-centers struggle to find a stand to reorganize the space.
Anyway, it is impossible to give a perfect and everlasting coat to any city, all the urban shape or structure is not static—in another word ‘dynamic’. But how and why? How it transforms and what makes them dynamic?
To give a complete answer seems hard, because any answer might become an influential factor for the following change. However, as water can have shape if it is put into a container, we can carry out a discussion about the dynamic density and structure within a certain scope.
The scope for the case of Beijing is its transformation from a Planned Economy to a Market-oriented Economy. In a pure Market Economy, demand and need decides the social activities, including the spatial migration. The commercial activity and industry showed the most sensitive reaction as land price in the near and outer suburbs was much lower than that of the center. As land price gradient sharpens, high level service industry replaces the former industry and residential land close to the center.
However, there is an exception which should be included, the real geometric center of Beijing acted much less than the usual commercial center, because it is an untouchable cultural heritage, with highly accumulated residence and low level industry. Taking this center-we call it black hole away, then there is no center for Beijing, thus the mono-centric model loose its stand.
Then we go back to the fact which is shown in Fengjian and Zhou Yixing’s poly-center model, only when these sub-centers collaborate organically can they perform the best result as one center, but this requires 2 preconditions, one of which is the spatial accessibility with which any two of the sub-centers can communicate as if there is no distance, the second of which is to the accessibility for the people to and from work cost as least time as possible. In this way, the sub-centers co-exist as one center while exerting their individual functions, and as sub-center provide more fractional space for residence, average commuting time for each person in a city declines.
Hence, one might refer to a model like this: sub-centers are connected with excellent ‘arteries’ while the residences closely encircle sub-centers. But in Beijing, the case is that the central black hole deters direct link between sub-centers and the spreading residence tries to find as cheap land as possible at the cost of long commuting distance in the periphery of the 5th ring, leaving blanks in the 3rd and 4th ring which add meaningless time in the car or on the buses.
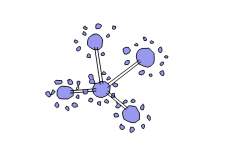
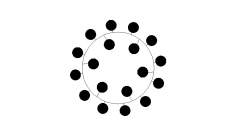
Picture 3: converging the sub-center into one entity—two models
However, we can still tentatively find a model which overcomes the two disadvantages. A high-speed circular vein connects the CBD, the Hi-tech manufacture site in the northeast, Zhongguancun , the Financial district and the Headquarter Basement in the west and the retail and service center in the southwest and the south areas, etc. The ‘thread of the necklace’ will perforate and connect the ‘diamonds’--the sub-centers and residence on both sides, converging the sub-centers into a linear entity. The residence on both sides can find a direct and short link to their working sites. What coincides so well is that the present economical activities are assembling both in the sub-centers and macroscopically towards the invisible circular center.
If put all the data into a generous typology, for example, the 10-storey building, the space within the 5th ring is far enough to accommodate all the economical activities and population of Beijing with a fair population density and proper spatial industry distribution. At this point we say, sprawling(both trans-sprawl and ) and satellites are not inevitable trend in Beijing.
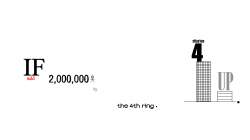
Picture 4: if the 2 million people in the future all go to the 4th ring, we only need to raise each building 4 stories up.
However, having talked about that, we still have to consider all the above within a market economy which is more or less under the influence of government policy. How to solve the present transportation and ‘sprawling’ questions is not only a theoretical problem but also determined by how the market and the government apportion the whole work. Both building satellite cities and balancing the land price could find successful and unsuccessful examples in other cities around the world, however, one thing should be clear which is that policy, market and proper planning(theory and technology) act side by side in shaping the future of a city, any variation in the factors forms diverse city. To sort out these actions and reactions needs dynamic views and is the next step I should consider for dynamic density.
References:
Alain.Bertaud & Stephen. Malpezzi. The Spatial Organization of Cities. Efficiency in Land Use and Infrastructure Design. http://alain-bertaud.com/
Fengjian & Zhou Yinxing. The Growth and Distribution of Population in Beijing Metropolitan Area (1982-2020). ACTA GEOGRAPHICA SINICA, Vol.58, No.6, Nov., 2003.
Neville. Mars. …
COMPARISON OF POPULATION DENSITY BETWEEN BEIJING AND SEOUL:
Entry:418 981
Integral Green Design--A***Approach
Green design or ecological design emerges with the call of global warming. However, in China or even in most of the world, green seems to be not so economically green that it is less easier popularized than even fashion in our thinking. Then here comes our question: why is green design still so much like a piece of art work that stays in the exhibition window rather than get into our daily life when every brand of sweet candy has a printed green sign.
The hypothesis might be: it takes much longer time for the product of green design to mature to go to the market. Or there is limited chance of packaging this huge and broad stuff into a standard shelf product, because the product depends dynamically. Or the market is blind that the customers don’t accept this product yet. Or there is alternative product which is way cheaper…
However, there are a lot of green products, solar panels, hydrogen cars, recycling plants, energy-saving lights, etc. In design, green goes to the structure, material as well as the equipments of the architectures, also in cities, green parks and ecological belt are frequently used. But as we mentioned before, people retard to use them in general situation, and the cities are still haunted by large hard surfaces, thick skyscraper and dead corners which rarely show any green or humanistic thinking. Even in parks, the artificial roads or ponds or fountains barely provide any spiritual release but just like stereotyped patterns or decorations.
We are not going to talk about the naff designing skills but about the fractional green designing, which is based on front skills and technologies but poor in situation accommodating and problem solving. In this fractional designing process, the designers care more about the independent outcome of product, and attach green skills onto it before fit it into any roof of the architectures or any parks whether it is in the north or in the south of China. They help the solar panel companies to sell the solar panels or they accidentally help developers to sell the houses by moving lawns to the roofs and leave the roads bold to sun. This kind of designing is not real green design, they are good applicator of green products.
In contrast, real green design should be integral designing, which makes each product not an assembly of green product, but focus more on the living space and living quality with solutions uniquely green. Green design in this situation is an application of green idea and thinking rather than green on-sale products. This involves that the green is recognizable by the market and easy to accept and apply in the daily life, and it won’t be used by sacrificing other big enjoyments.
But how to do such designing?
Detail……………………………………………………
Owned by Hongdan Yue / Added by Hongdan Yue / 17.2 years ago / 23974 hits / 40 minutes view time
Backlinks
Tags
Latest Entries
Contribute
Login to post an entry to this node.