Perceived density
感知密度
or DENSITY IS NOT A FORMULA
- Research Saskia Vendel, text Neville Mars
Density is too easily a numbers game: for developers, a relationship between land costs and unit retail value; for planners, one between anticipated population growth and desired urban footprint. Among architects, density numbers are revered almost as pure ideals — spinning in the corner of a technophilic animation, or acting as springboards into abstract datascapes and bar chart tower blocks. And yet actual or prospective residents, when considering what a place might be like to live in, are seldom exposed to or concerned with these numbers — mostly because the numbers in themselves do little to describe the condition.
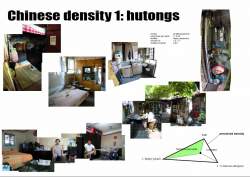
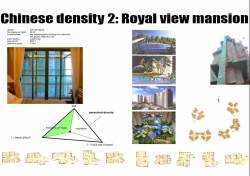
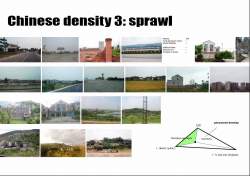
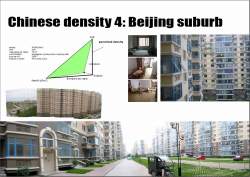
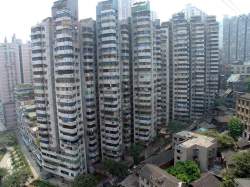
Questions as to whether an area feels vacant, neighborly, or crammed — even whether it feels dense or not dense — are given little by way of satisfactory response by the figures. Traditional hutongs* in the middle of Beijing tally a similar number of people per square kilometer as the suburban mega-development Tian Tong Yuan, and yet they are radically different environments. Equally, the Floor Area Ratio (FAR) of a communist dormitory block is close to that of a modern stacked villa — a typology designed, built and marketed at the new economic elite.
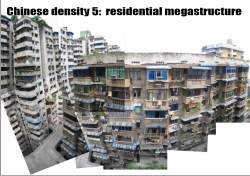
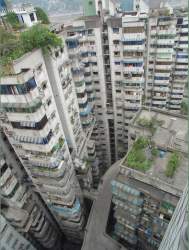
Clearly the experience of space and density elude conventional density metrics.This is because the soft information that comes with being somewhere is often more evident and more powerful than the underlying density numbers. Density perception, rather than relating to a formula, is contingent upon a number of whole environment factors, and therefore requires a holistic and intuitive approach.
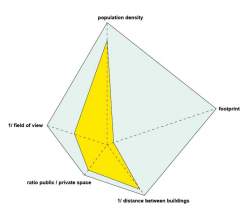
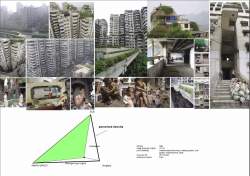
The perceived density diagram (above) is a soft measure of the density of a particular area as gleaned by living in it. It incorporates five variables: the height of the surrounding buildings; the spacing between them (with narrow spacing producing a higher perceived density); the footprint of the buildings (do they present massive objects on the ground?); the viewing scope to which residents have access (with shorter views producing higher perceived densities); and the amount of outdoor private space available to residents (e.g. courtyards, gardens; with smaller private spaces producing higher perceived densities). The irregularity of the black pentagon takes into account the varying significance of these factors upon the overall perceived density. Plotting points on the five axes yields the perceived density graphic — a pink pentagon whose shape and area are an expression of perceived density.
Illustrator file of Star diagram perceived density

Owned by neville mars / Added by Stephanie Yao / 17.8 years ago / 194226 hits / 4 hours view time
Tags
Latest Entries
-
Question, FAR?
-
Star diagram perceived density
-
Perceived density new added
-
Perceived density pics
-
Perceived Density Draft PDF 1
Contribute
Login to post an entry to this node.